
Viewer guide
The viewer lives in viewer/ and is a Vite + React Flow app. It reads graph.json from the project root (or a path configured via VITE_ARCLENS_PROJECT_ROOT in watch mode).
Start the viewer
Section titled “Start the viewer”pnpm analyze ./samplespnpm dev:viewerFor live updates while editing code:
pnpm dev:watchLayout overview
Section titled “Layout overview”The viewer has three main areas:
- Left sidebar:search, folder overview, entry points, and hub nodes
- Graph canvas:interactive nodes and edges with pan, zoom, and drag
- Details panel:metadata, connections, props, and source preview for the selected node
Floating panels are draggable and resizable; positions persist in local storage.
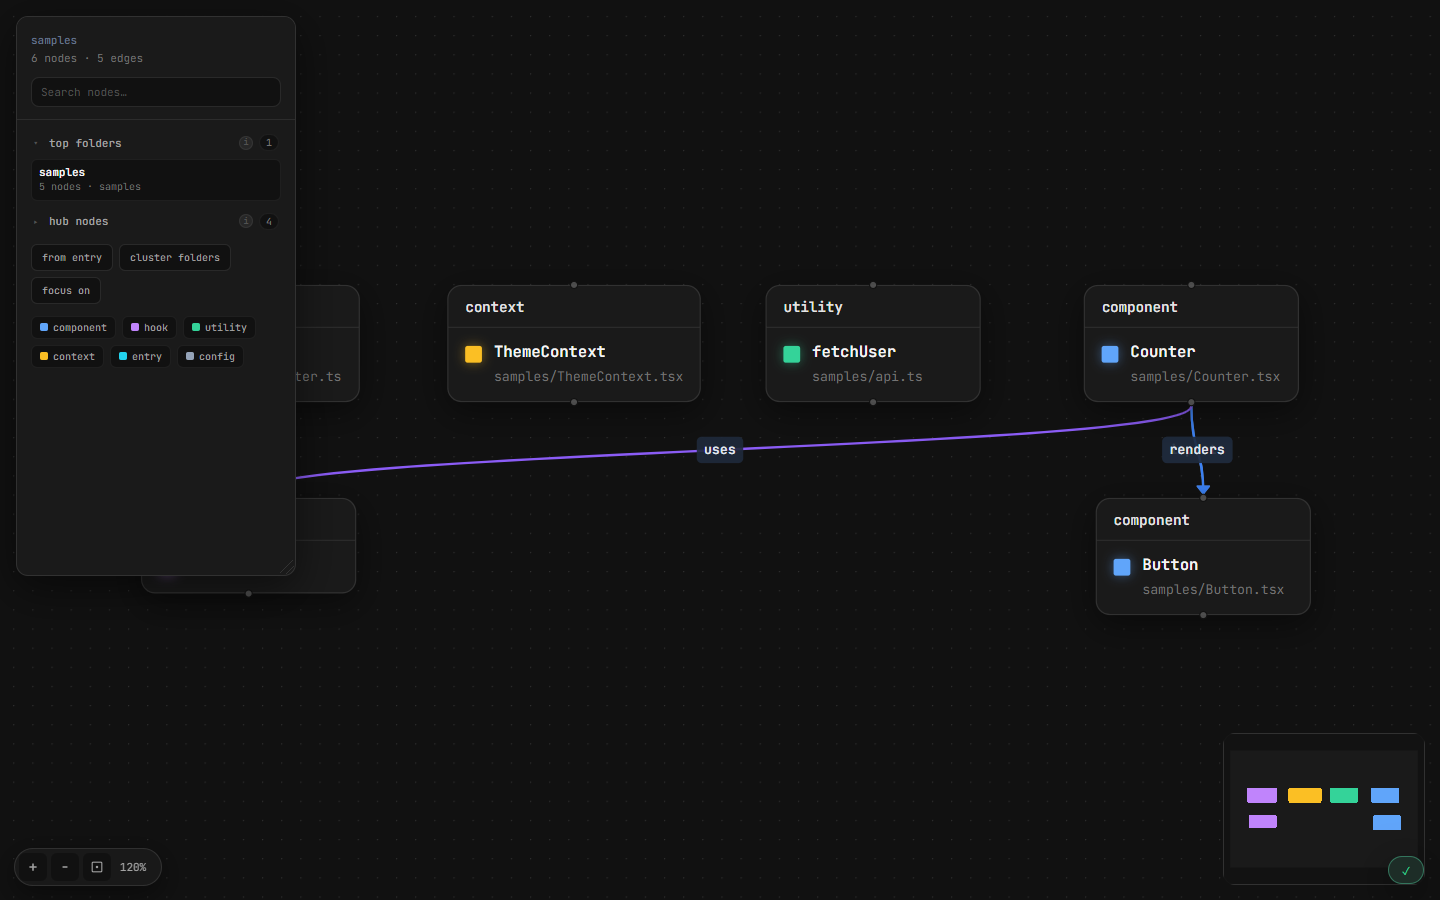
The screenshot above uses the samples fixture:a small graph with components, hooks, utilities, and context nodes connected by import, render, and use edges.
Search
Section titled “Search”Use the search field in the top-left panel to filter nodes by name.
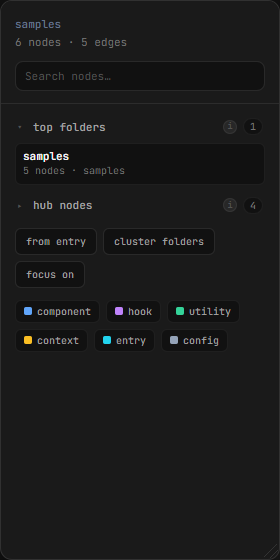
The sidebar keeps search and project stats pinned at the top while folder, entry, and hub lists scroll underneath.
On large graphs (above the virtualize threshold), search switches to subgraph mode: only matching nodes and their immediate neighborhood are shown, keeping the canvas responsive.
Search also reveals matches inside collapsed folder clusters and highlights the folder bubble so you can find nodes like LendhaRouter even when their folder is still collapsed. See Large project walkthrough for the full navigation playbook.
Folder overview
Section titled “Folder overview”The Folders section lists top folders by node count. Click a folder to:
- Collapse the graph into a folder cluster node
- Drill into individual files inside that folder
Folder clustering helps you navigate monolithic apps without rendering every node at once.
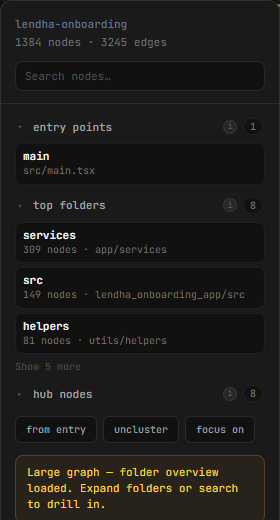
On large graphs, the sidebar loads a compact folder overview first. Expand folders or search to drill into specific areas without rendering every node at once.
Entry points
Section titled “Entry points”The Entry points section lists likely app bootstrap files (main.tsx, src/index.tsx, Next.js app/layout.tsx, etc.). Entry detection skips tests, stories, mocks, and setup files.
Click an entry to select it and highlight the path from that entry through the dependency graph (From entry path highlighting).
Hub nodes
Section titled “Hub nodes”Hubs are nodes with the highest total connection degree (incoming + outgoing). They often represent shared layout components, design-system primitives, or utility modules that many features touch.
Insights badge
Section titled “Insights badge”When graph.json includes insights (always written by analyze), an Insights badge appears on the canvas.

- The badge summarizes counts by severity: error, warning, info, tip
- Click it to open a drawer listing every insight with title, detail, file, and optional ESLint rule id
- Press
Escapeor click outside to close
Insights in the viewer mirror CLI --insights output, orphan exports, naming hints, Rules of Hooks violations, and more.
Node details
Section titled “Node details”Click any node to open the details panel:
| Field | Description |
|---|---|
| Name / type | Component, hook, context, utility, entry, or config |
| File path | Relative path in the analyzed project |
| Export kind | Default or named export |
| AST kind | Declaration shape ts-morph detected |
| Props | Component prop names and types when available |
| Connections | Incoming and outgoing imports, renders, and uses |
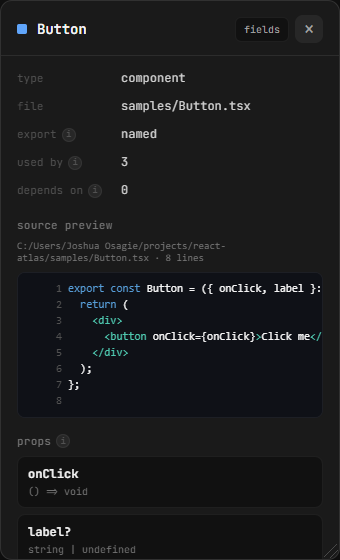
Selecting a node opens the details panel on the right with type, usage counts, props, and a syntax-highlighted source preview.
Node toolbar
Section titled “Node toolbar”When a node is selected, a toolbar offers:
- Focus:center the viewport on the node
- Copy name:copy the symbol name
- Copy path:copy the file path
Source preview
Section titled “Source preview”The details panel includes a Source preview section that loads a truncated snippet of the node’s file.
Preview resolution order:
- Live read via the dev server API (when running
dev:viewer/dev:watch) - Sidecar files from
--with-snippets(.arclens/snippets/)
Syntax highlighting covers comments, strings, keywords, JSX tags, and numbers. Truncated files show line counts (e.g. “showing 120 of 340 lines”).
Graph interactions
Section titled “Graph interactions”- Click a node to select and open details
- Drag nodes; helper lines snap alignment while dragging
- Mini-map and zoom controls in the corner
- Viewport position and zoom persist across sessions
- Selection dimming:unrelated nodes fade; path from entry highlights when applicable
Large graphs
Section titled “Large graphs”When node count exceeds thresholds, the viewer automatically:
- Uses pre-layout coordinates from
graph.jsonwhen present - Falls back to Dagre layout in the browser
- Virtualizes rendering for very large graphs
Run analyze on a subfolder (e.g. ./src/features/checkout) if the full repo graph is too dense.
Missing graph
Section titled “Missing graph”If graph.json is missing or invalid, the viewer shows a clear empty state instead of a blank page:
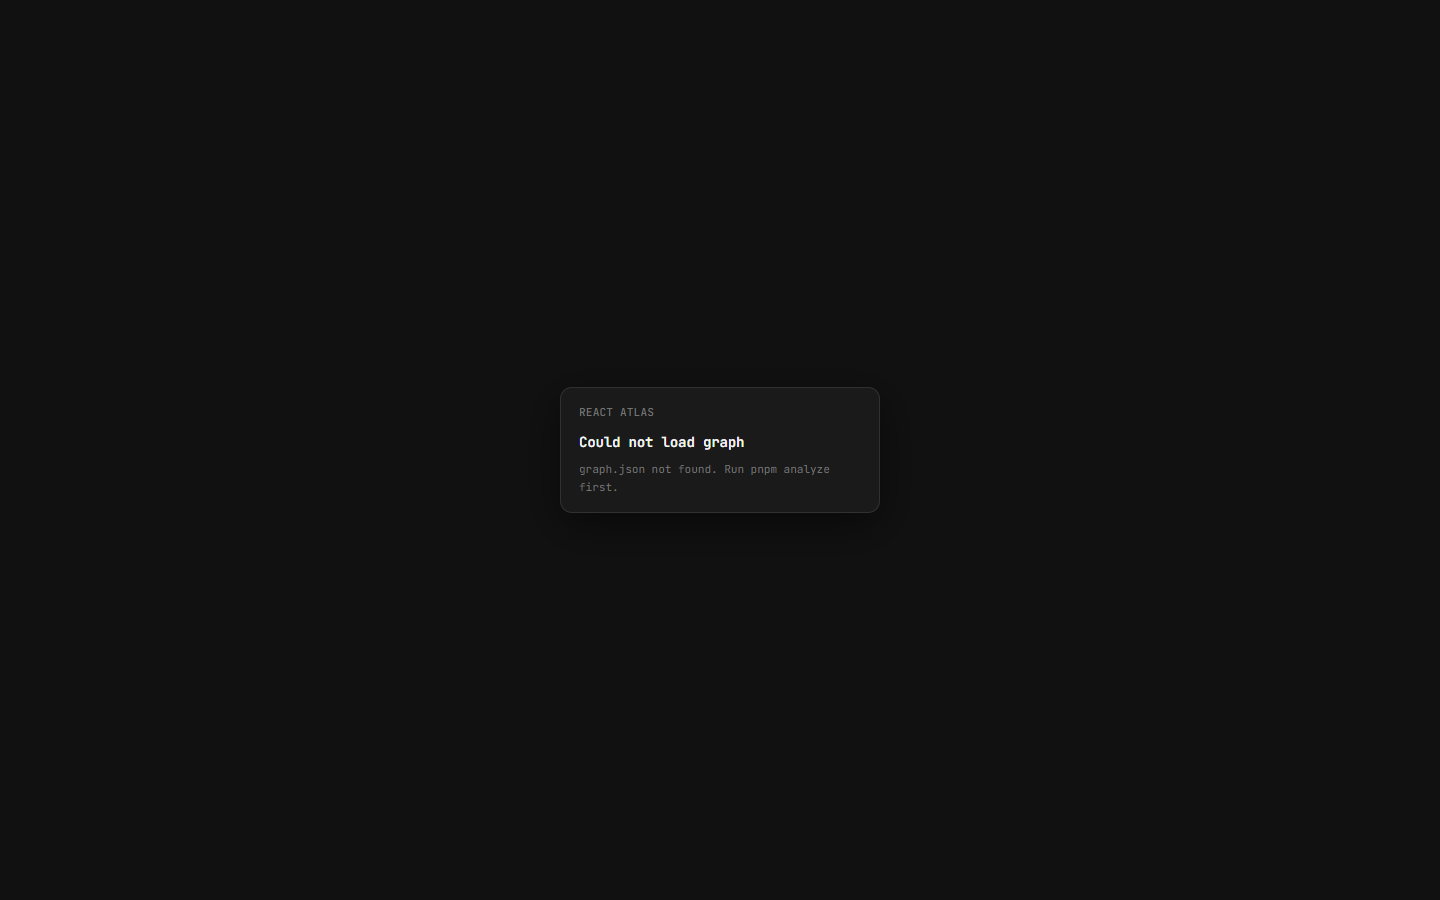
Run pnpm analyze <path> first, then refresh or restart pnpm dev:viewer.
Configuration
Section titled “Configuration”Viewer behavior is tuned in viewer/src/viewerConfig.ts (thresholds for large graph mode, overview list sizes, poll interval for graph.json changes).